Overview
Sunbursts are similar to Sankeys in that they visualize patterns, but differ in how the patterns are calculated. In Sankeys, states are calculated at cross-sectional points in time and presented as flows through time. In sunbursts, order, irrelevant to time, is considered in calculation of the pattern. For example, a patient who is on Treatment A for one year then Treatment B for one day would have the exact same pattern as someone who is on Treatment A for one day, then transitions to Treatment B for one year (A -> B).
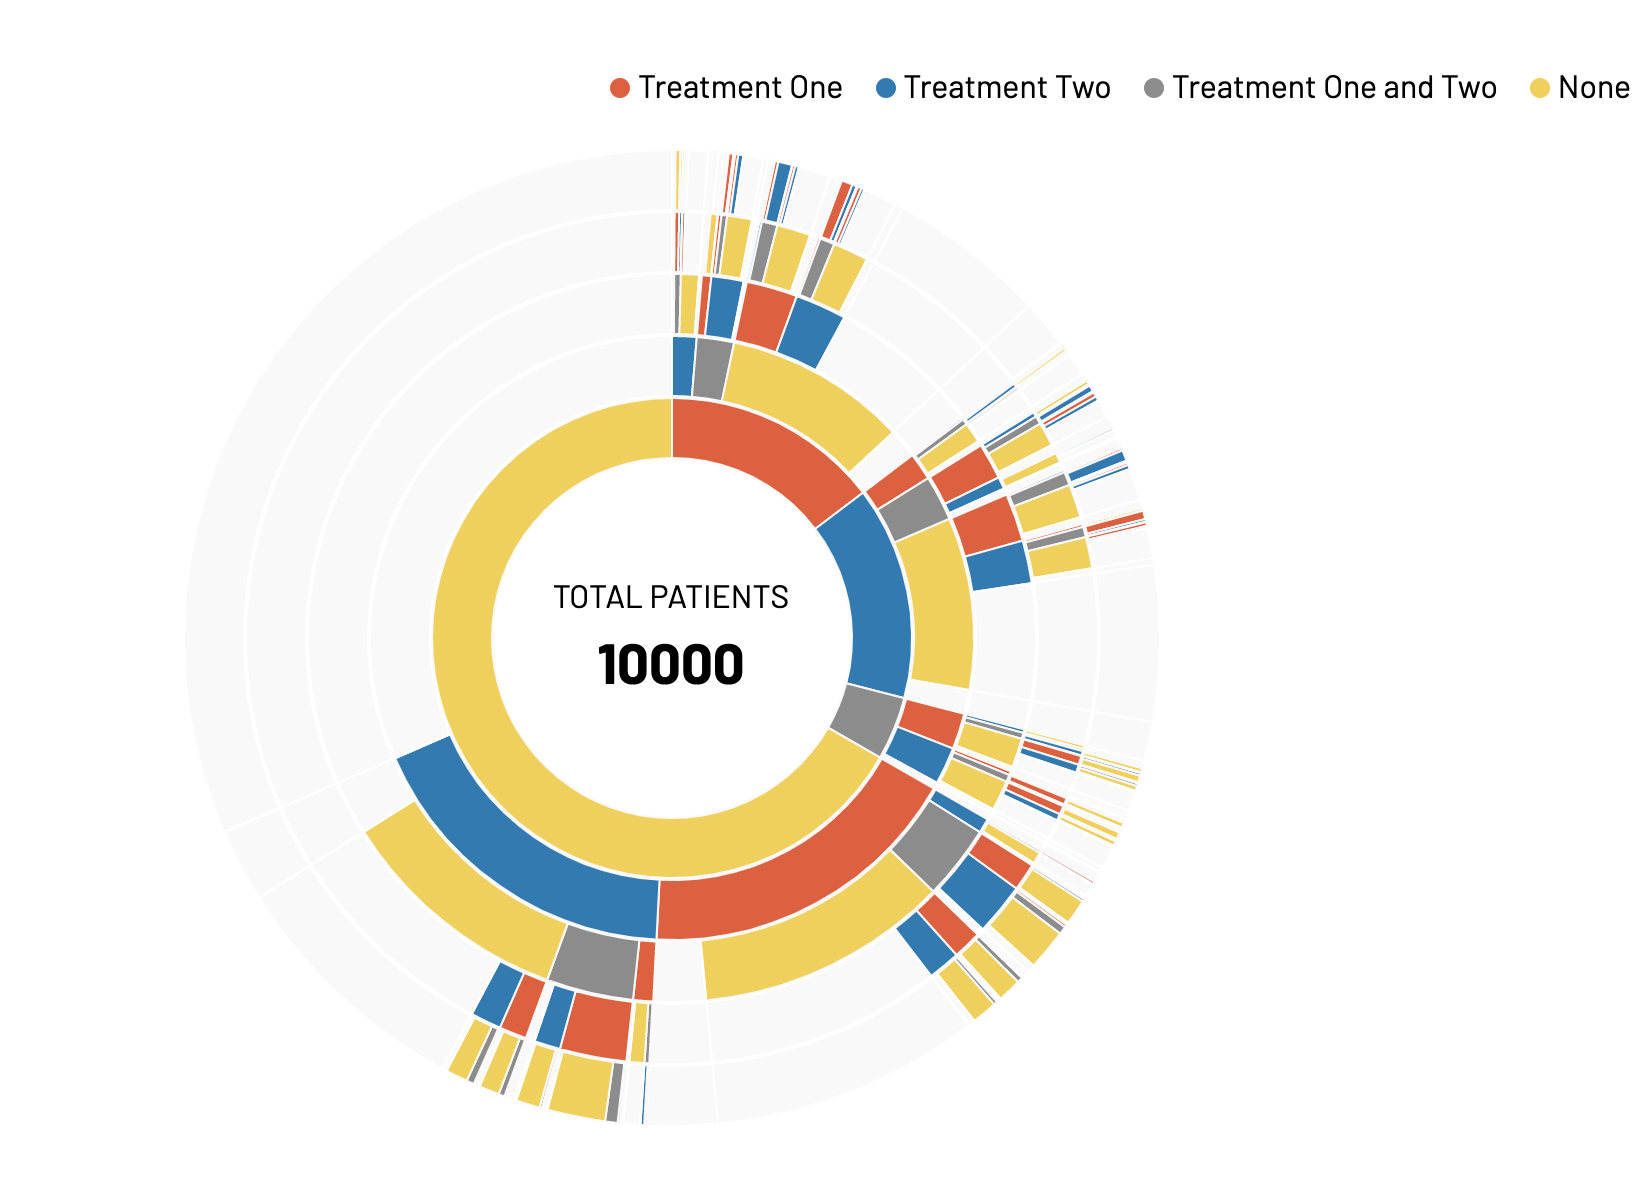
Basic Sunburst
First, the id level data are created used
sunburst_id_data. This is to help facilitate running on
partitions on the id-level first, before the summarizing step in
sunburst_maker. sunburst_id_data requires a
cohort, an ansible style data.frame, and which “states” are
wanted. It returns a list of the resulting data.frame and the states, so
it can directly be fed into sunburst_maker.
events <- nsSank::convert_tagged_cdf(cdf)
data   <- nsSank::ansible(events)
data
#> # A tibble: 58,292 × 4
#>    patient_id start      end        state
#>         <int> <date>     <date>     <list>
#>  1          1 2010-02-21 2010-02-28 <chr [1]>
#>  2          1 2010-03-01 2010-03-31 <chr [2]>
#>  3          1 2010-04-01 2010-05-22 <chr [1]>
#>  4          1 2010-08-06 2010-09-03 <chr [1]>
#>  5          1 2010-09-04 2010-09-05 <chr [2]>
#>  6          1 2010-09-06 2010-11-03 <chr [1]>
#>  7          1 2010-12-09 2011-03-09 <chr [1]>
#>  8          3 2010-03-22 2010-06-20 <chr [1]>
#>  9          4 2010-01-28 2010-03-29 <chr [1]>
#> 10          5 2010-01-30 2010-04-16 <chr [1]>
#> # ℹ 58,282 more rows
sdata <- nsSank::sunburst_id_data(cohort, data, states = c("a", "b"))
#sdata$id_data
sunburst_list <- nsSank::sunburst_maker(cohort, sdata, max_levels = 5)
nswidgets::create_sunburst(sunburst_list$data, sunburst_list$types)